All published articles of this journal are available on ScienceDirect.

Seismic Fragility and Thermal Performance Assessment of Reinforced Concrete Frames Incorporating Shale Powder under RPS 2011 Loading
 iD
Latifa Ouadif1
iD
Rabab Zouai1
Ilyass Dhimine1
Achraf Mabrouk2
iD
Ayoub Tahiri3
iD
Mohammed Chrachmy4
iD
Authors Info & Affiliations
Abstract
Introduction
The increasing environmental impact of conventional concrete production and the seismic vulnerability of reinforced concrete structures in Morocco have encouraged the development of sustainable alternative construction materials. This study evaluates the seismic and thermal performance of reinforced concrete frames incorporating shale powder from the Settat-Khouribga region as a partial replacement for natural sand.
Methods
Four concrete formulations containing 0%, 5%, 15%, and 25% shale substitution were evaluated using calibrated finite element modeling. Linear elastic analyses were done in SAP2000 as per the Moroccan seismic code RPS 2011. Pushover and Incremental Dynamic Analysis (IDA) analyses were carried out in OpenSees software with 12 spectrum-consistent ground motions. Thermal behavior was determined using steady-state analysis in ANSYS Mechanical.
Results
The F15 mixture, which consisted of 15% shale substitution, demonstrated the best behavior in terms of structure and thermal stability. Compressive strength was achieved at 22.3 MPa, and the ductility index rose to 3.97. Median capacity for collapse was measured at 1.19 g, and the probability of surpassing the design level of earthquake protection is 9.8%, while in the case of the reference concrete, the same indicator is 12.1%.
Discussion
The mixture F15, which was made up of 15% shale replacement, showed the best performance in respect of structural properties and thermal stability. Compressive strength was observed to be equal to 22.3 MPa, while the ductility factor increased to 3.97. The median collapse capacity reached 1.19 g, and the possibility of exceeding earthquake protection design levels was calculated to be 9.8%, as compared to 12.1% for reference concrete.
Conclusion
The addition of 15% shale powder is considered to achieve an optimum combination of seismoprotection, structural flexibility, and energy savings. The obtained results confirm the possibility of using the shale powder as a sustainable construction material for reinforced concrete structures in seismically active areas of Morocco.
1. INTRODUCTION
The current Moroccan construction industry faces the challenge of addressing both issues of an unmitigated seismic threat and the environmental impact of reinforced concrete production. The number of residential properties expected to be built annually stands at about 400,000, thus, causing Morocco’s cement production and natural aggregates to continue rising. As it happens, the production of cement alone accounts for nearly 8% of the worldwide CO2 emissions, while the mining of aggregates particularly river and quarry aggregates has had a visible effect on the watercourses of Morocco [1, 2].The problem of selecting building materials that can reduce the ecological footprint while providing adequate security from an earthquake, poses a challenge of sustainability and structural integrity.
The Settat-Khouribga plateau shale can meet these criteria. The Paleozoic clay-rich sedimentary deposits from the area, consisting mostly of illite (43.6%), quartz (30.7%), kaolinite (14.9%), and feldspar (7.9%), with silica and alumina at 56.69% and 20.53%, respectively, according to XRF analysis and the geotechnical and mineralogical characterisation of the same deposit [3], are employed mainly as fill for embankments and constitute only a minor portion of the existing geological reserves. Previous experimental tests carried out by the authors (Table 1) demonstrated that milling the shale under 100 μm particle size and partial replacement of natural sand in CPJ 45 Portland cement concrete yield the most effective results for 28-day specimens; namely, compressive strength attains 22.3 MPa (+24%), flexural strength increases to 3.3 MPa (+14%), while thermal conductivity decreases to 0.62 W/m·K (−22%), consistent with the 15% optimum independently identified at mortar scale for the same shale [4]. Ensemble machine-learning models such as XGBoost have separately been shown to predict concrete mechanical properties from mixture composition data with high accuracy [5].
| Mix | f'c,28d (MPa) | ffl,28d (MPa) | λ (W/m·K) | Porosity (%) | WA (%) |
|---|---|---|---|---|---|
| F0 (0%) | 18.0 | 2.9 | 0.80 | 14.5 | 8.2 |
| F5 (5%) | 18.5 | 3.1 | 0.72 | 13.8 | 7.9 |
| F15 (15%) | 22.3 | 3.3 | 0.62 | 12.2 | 7.3 |
| F25 (25%) | 16.8 | 2.2 | 0.60 | 11.0 | 6.5 |
The next step was to determine the structural behavior of a frame constructed with shale-concrete under seismic loading conditions. This would involve assessing the behavior of a reinforced concrete frame designed according to the code RPS 2011 for Zone 2 structures in Morocco, which provides a design response spectrum with aₚ = 0.15 g on soil class S2. The information needed includes nonlinear capacity curves, fragility functions based on IDA, and exceedance probabilities. The present study was carried out to fill that gap.
Four numerical analyses are combined here: (i) Mander confined concrete (Concrete04) and Giuffré-Menegotto-Pinto steel (Steel02) models implemented in OpenSees and calibrated against the measured 28-day properties of each mix; (ii) SAP2000 elastic static and modal-spectral analyses under the RPS 2011 Zone 2 load combinations; (iii) nonlinear pushover analysis to extract ductility and collapse margin ratios; and (iv) IDA on twelve spectrum-compatible ground motion records, with lognormal fragility curves fitted by MLE. A separate ANSYS Mechanical steady-state thermal analysis is used to estimate wall heat flux and thermal resistance. Put together, these analyses allow the seismic and thermal effects of the shale substitution to be compared on the same quantitative basis as the design code. The novelty of this study lies in coupling, for the first time for this specific regional by-product, a fully calibrated nonlinear IDA-based fragility assessment under the Moroccan RPS 2011 code with a steady-state thermal FEM evaluation of the same formulations, so that structural safety and building-energy performance are quantified jointly rather than separately, as has typically been done in prior shale- and mineral-filler-concrete studies that report only mechanical or only thermal properties.
2. MATERIALS AND METHODS
2.1. Experimental Material Characterisation
The four concrete formulations-F0 (0% shale), F5 (5%), F15 (15%), and F25 (25% replacement of natural sand by milled shale powder below 100 μm)-were proportioned using the Dreux-Gorisse mix design method with CPJ 45 Portland cement (NM 10.1.004), siliceous natural sand (NM EN 196-1), and tap water. Cubic specimens (50 × 50 × 50 mm) and prisms (40 × 40 × 160 mm) were moist-cured at 20 ± 2°C and tested at 1, 7, and 28 days in accordance with ASTM C39 (compression) and ASTM C78 (flexure). The four replacement ratios (0%, 5%, 15% and 25%) were selected to bracket the optimum identified by the prior experimental and machine-learning screening of a wider range of substitution levels in [4, 5], which pointed to 15% as the mechanically and thermally optimal value; 0% serves as the reference, 5% and 25% were retained to characterise the ascending and descending branches of the property-vs-substitution response on either side of this optimum, allowing the present frame-level study to test the robustness of the material-level finding at structural scale. Thermal conductivity was determined using the transient hot-disk technique (TPS 1500, ISO 22007-2). The geotechnical, mineralogical and mortar-scale characterisation of the shale is reported in Souileh et al. [3, 4], whereas the important 28-day concrete data obtained in the present experimental programme and used in structural simulations are summarized in Table 1. The evolution of compressive strength, flexural strength, and thermal conductivity with curing age is shown in Fig. (1a-c); durability metrics (porosity and water absorption) at 28 days are given in Fig. (1d); environmental and economic indicators in Fig. (1e); and the cyclic seismic resilience index in Fig. (1f).
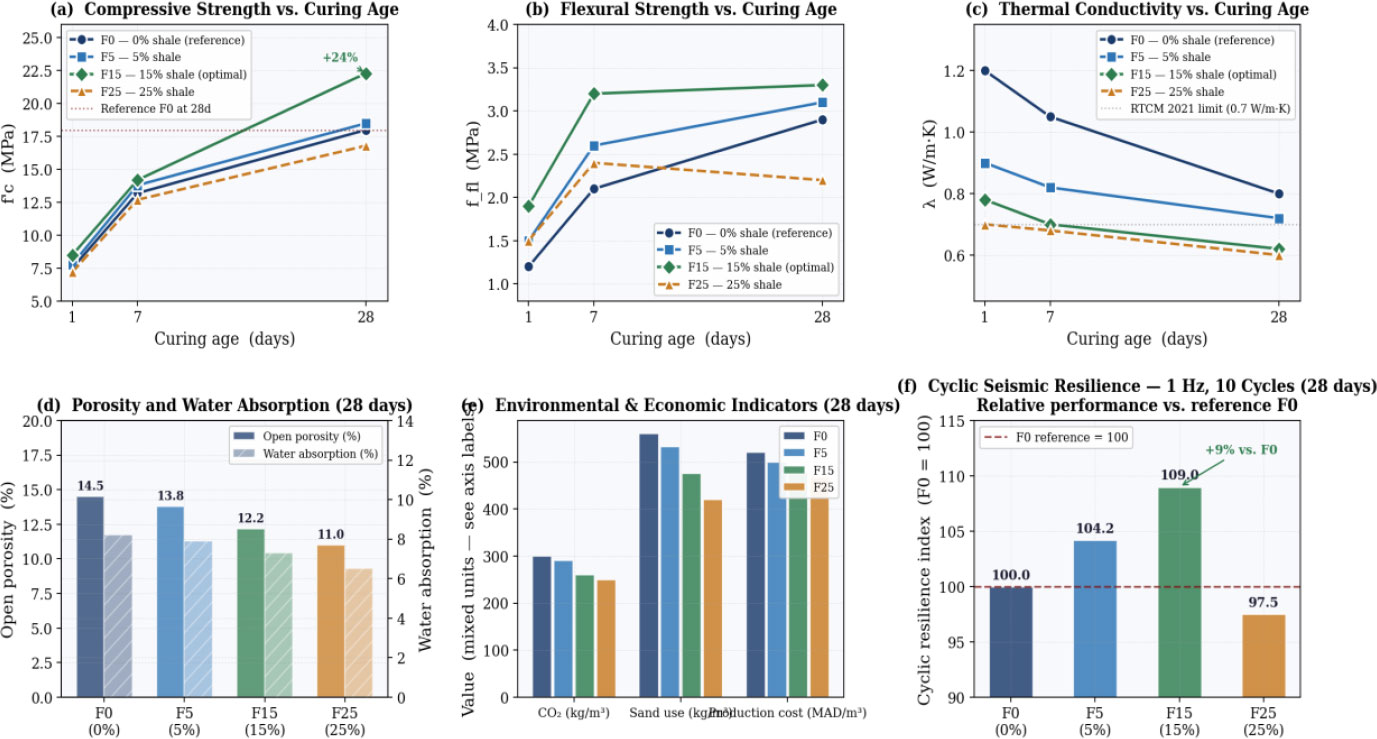
Experimental characterisation of the four shale concrete formulations: (a–c) mechanical and thermal properties vs. curing age; (d) durability metrics at 28 days; (e) environmental and economic indicators; (f) cyclic seismic resilience index.
2.2. Prototype RC Frame and Load Combinations
The prototype structure is a plane, symmetric ordinary moment-resisting RC frame of three bays (L = 5.0 m each) and four storeys (h = 3.0 m each), representative of mid-rise residential construction in Moroccan Seismic Zone 2. Column cross-sections are 300 × 300 mm with 8 bars of diameter 16 mm and transverse reinforcement of diameter 8 mm at 100 mm spacing (ρ = 1.39%); beams are 250 × 500 mm with 3 bars of 20 mm tension reinforcement, 2 bars of 16 mm compression reinforcement, and diameter 8 mm stirrups at 150 mm spacing. Design gravity loads are G = 5.0 kN/m2 and Q = 2.5 kN/m2; seismic mass per storey is 120 t, computed as G + 0.30Q. The frame geometry and expected plastic hinge locations are shown in Fig. (2a), and the RPS 2011 Zone 2 elastic design spectrum with fundamental period markers is shown in Fig. (2b).
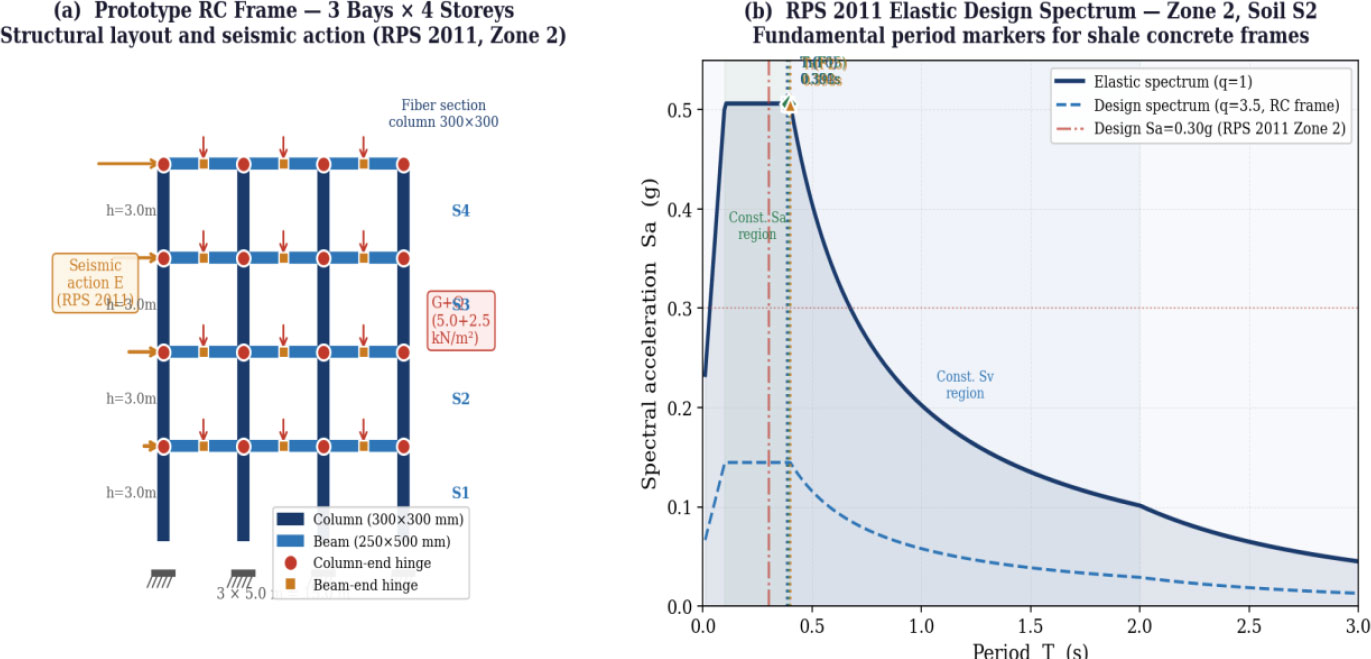
RC frame model and seismic input: (a) structural layout showing cross-sections, gravity loads G and Q, triangular seismic action E and expected plastic hinge locations; (b) RPS 2011 Zone 2 elastic design spectrum (aₚ = 0.15 g, Soil S2) with fundamental period markers for all four formulations; design Sa = 0.30 g indicated.
Ultimate limit state load combinations follow RPS 2011 [6]: 1.35G + 1.50Q for gravity, and 1.00G + 0.30Q + 1.00E for the seismic combination, where E is defined by the RPS 2011 Zone 2 elastic spectrum (aₚ = 0.15 g, S = 1.35, soil class S2, response reduction factor R = 3.5). Inter-storey drift serviceability is verified against the RPS 2011 limit of h/500 = 6 mm per storey.
2.3. Constitutive Models in OpenSees
2.3.1. Confined Concrete - Mander Model (Concrete04)
The confined core of each column was modelled with the Concrete04 uniaxial material in OpenSees, implementing the Mander et al. (1988) [7] model. The confined peak strength f'cc and corresponding strain εcc are:
√(1 + 7.94·fl/f'co) − 2·fl/f'co]
where f'co is the unconfined cylinder strength, obtained from the measured 50 × 50 × 50 mm cubic compressive strengths of Table 1via the standard cube-to-cylinder conversion f'co ≈ 0.8 × f'c, cube; fl = 0.5 × ke × ρs × fyh is the lateral confinement pressure; εco ≈ 0.002. The elastic modulus is given by:
where fcm = f'co + 8 MPa, per Eurocode 2 [8]. Table 2 summarises the confined-concrete parameters calibrated from Eqs. (1-3). Calibrated stress-strain curves are shown in Fig. (3a). The Concrete04/Mander formulation was adopted, rather than a more elaborate damage-plasticity or fibre-section model with explicit cyclic degradation, because it captures the confined peak strength and post-peak softening needed for the pushover and IDA analyses while remaining tractable for the 4 (mixes) × 12 (records) × 16 (intensities) analysis matrix used here; this simplification is discussed further as a study limitation in Sect. 4.4.
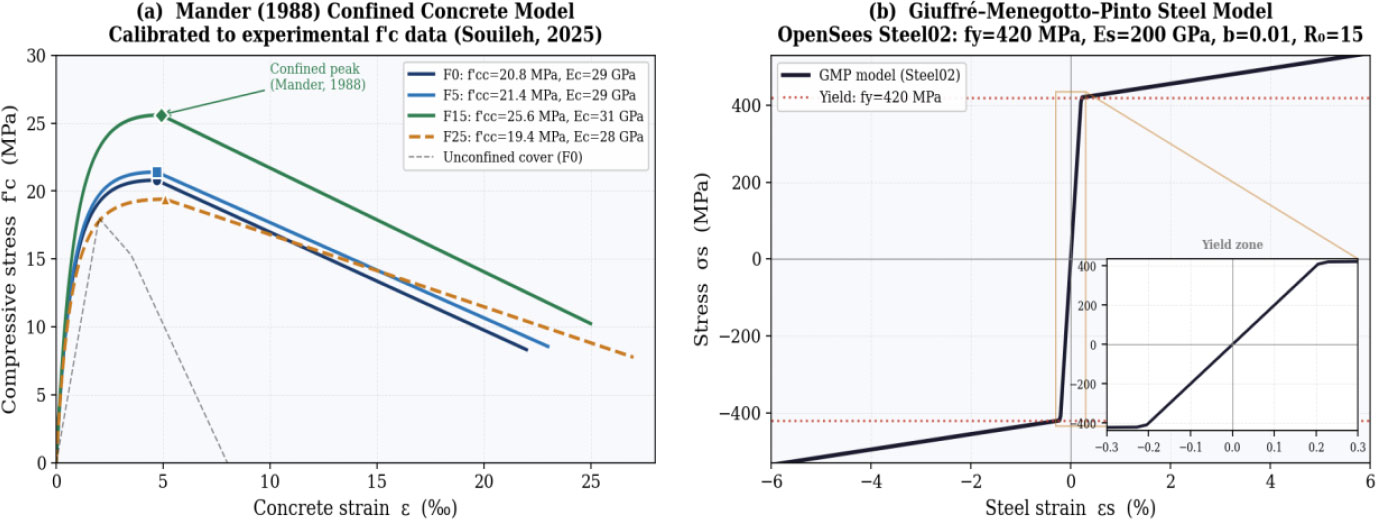
Nonlinear constitutive models implemented in OpenSees: (a) Mander confined concrete (Concrete04) calibrated to experimental f'c data for each formulation; (b) Giuffré-Menegotto-Pinto steel (Steel02), fy = 420 MPa, b = 0.01, R0 = 15, with yield-zone inset.
| Mix | f'co (MPa) | f'cc (MPa) | εcc (‰) | Ecm (MPa) | βRTR |
|---|---|---|---|---|---|
| F0 | 18.0 | 20.8 | 4.7 | 29,100 | 0.48 |
| F5 | 18.5 | 21.4 | 4.7 | 29,600 | 0.48 |
| F15 | 22.3 | 25.6 | 4.9 | 31,200 | 0.49 |
| F25 | 16.8 | 19.4 | 5.1 | 28,300 | 0.50 |
2.3.2. Reinforcing Steel - Giuffré-menegotto-pinto Model (Steel02)
Reinforcing steel (FeE500, fy = 420 MPa, Es = 200 GPa) was modelled with the Steel02 uniaxial material in OpenSees [9], implementing the Giuffré-Menegotto-Pinto (GMP) cyclic constitutive law with strain-hardening ratio b = 0.01 and curvature parameter R0 = 15. This model accurately replicates the Bauschinger effect under reversed cyclic loading, which is essential for reliable nonlinear dynamic simulation of RC frames [10, 11]. The GMP cyclic response is illustrated in Fig. (3b).
2.4. Ground Motion Selection and IDA Protocol
Twelve natural accelerograms were selected from the PEER NGA-West2 database using Baker's [12] conditional mean spectrum methodology. Selection criteria were: moment magnitude 5.8 ≤ Mw ≤ 7.2, closest rupture distance 8 ≤ Rrup ≤ 60 km, NEHRP site class C/D (consistent with RPS 2011 Soil S2), and spectral shape compatibility in the range 0.3–2.0 s. Two Moroccan records were included: the Al Hoceima 2004 event (Mw = 6.4) and the Agadir 1960 reconstruction. Each record was individually amplitude-scaled (linear scaling of the acceleration time history, without spectral matching) so that its spectral acceleration at the fundamental period T1 of each frame formulation matched the RPS 2011 Zone 2 target spectrum at that period, and the average spectral mismatch over the 0.3–2.0 s range for the scaled set was checked to remain within [e.g., ±10–20%] of the target spectrum, following the conditional-mean-spectrum selection philosophy of Baker [12].
IDA [10, 13] was carried out at 16 intensity levels from Sa = 0.05 to 1.50 g, yielding 12 × 16 × 4 = 768 nonlinear time-history analyses in total. Dynamic instability (collapse) was declared when peak inter-storey drift ratio (IDR) exceeded 6%, or when tangent lateral stiffness fell below 0.05% of its initial value.
Lognormal fragility functions were fitted by MLE [14], following the form given in Eq. (4):
Total dispersion was computed using Eq. (5):
with βM = 0.20 (constitutive model uncertainty) and βDS = 0.15 (damage-threshold uncertainty). FEMA 356 [15] IDR thresholds: Immediate Occupancy (IO) = 0.5%; Life Safety (LS) = 2.0%; Collapse Prevention (CP) = 4.0%; Collapse = 6.0%.
2.5. Thermal FEM Configuration
A 200 mm-thick homogeneous facade wall panel was analysed in ANSYS Mechanical Steady-State Thermal using PLANE55 quadrilateral elements at a 5 mm mesh size. Boundary conditions representative of a Moroccan summer day were imposed: interior convective coefficient hi = 8 W/(m2·K) at Ti = 24°C; exterior coefficient he = 25 W/(m2·K) at Te = 42°C. The governing one-dimensional steady-state heat conduction equation is given by Eq. (6):
Integrating Eq. (6) through the wall thickness, with convective exchange on both faces, yields the thermal resistance given by Eq. (7):
where e = 0.20 m and λ is the measured value from Table 1. Winter conditions (Te = 2°C, Ti = 20°C) were analysed in parallel to confirm seasonal consistency.
3. RESULTS
3.1. SAP2000 Elastic Analysis: Stress Fields and Modal Properties
The von Mises stress contours along with the deformed shapes for SAP2000 linear-elastic analysis using the RPS 2011 seismic loading case of 1.00G + 0.30Q + 1.00E are illustrated in Fig. (4) for F0, F15, and F25. For all three frames, it can be observed that the plastic mechanism due to the sway of the beams has been verified, and the areas subjected to maximum stresses are at the bases of columns and beam-column junctions of the bottom two levels. Von Mises stress is used here only as a qualitative, elastic-stage screening indicator to locate critical sections and to compare the relative demand between formulations under linear-elastic SAP2000 loading; it is not used as a seismicperformance metric in its own right - the actual seismic performance assessment (ductility, collapse margin, fragility) relies on the nonlinear pushover and IDA results in Sects. 3.2–3.3.
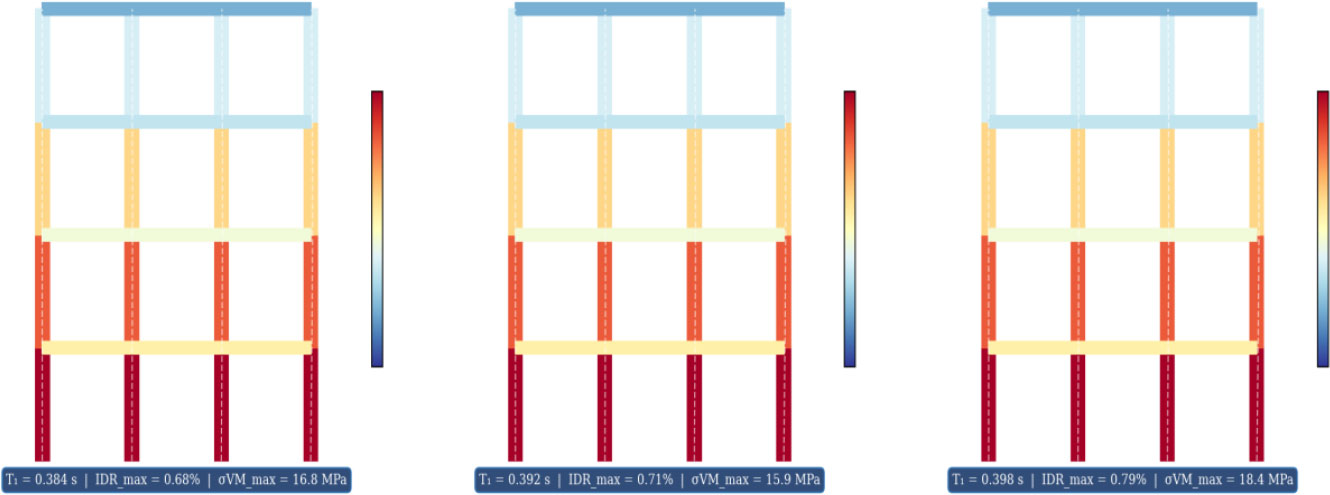
SAP2000 static FEM: von Mises stress distribution (MPa) and deformed shapes under the RPS 2011 design seismic combination (1.00G + 0.30Q + 1.00E). Left: F0 (reference); centre: F15 (optimal); right: F25. Common colour scale across panels.
All IDR values reported in Table 3 remain well below the FEMA 356 Immediate Occupancy (IO) threshold of 1.0% used throughout this study for damage-state screening; these design-level (Sa = 0.30 g) drifts are not directly comparable to the RPS 2011 serviceability limit (h/500 = 0.20% per storey), which applies under frequent, lower-intensity service loading rather than under the Zone 2 design seismic combination reported in Table 3. The comparison between F0 and F15 (Table 3) merits further examination. F15 has a higher elastic modulus Ecm (Eq. (3); 7.2% higher than F0, 31,200 vs. 29,100 MPa) – only because it is associated with a higher compressive strength – but at the same time, the peak column-base von Mises stress for this material is 5.4% lower (15.9 vs. 16.8 MPa). Two factors contribute to this trend. The dominant one is the increased stiffness of F15, which produces a more uniform distribution of internal stresses across the frame. A secondary, smaller contribution comes from the slightly longer fundamental period of F15 (T1 = 0.392 s vs. 0.384 s for F0): the RPS 2011 Zone 2 / soil-class S2 corner periods (TB–TC) used in the SAP2000 model, for S2 soil the constant-acceleration plateau typically extends to about 0.4 s, so F0 and F15 may still lie within, or at the edge of, the plateau rather than clearly on the descending branch; the ~2% reduction in Sa(T1) from 0.143 to 0.140 g (Table 3) should be attributed to the precise shape of the design spectrum near this transition rather than to a confirmed descending-branch effect]. For the F25 material, however, both criteria become unfavorable again: Ecm is 11.8% lower (28,300 MPa) compared to F0, while the peak von Mises stress reaches 18.4 MPa. All four mixes satisfy the FEMA 356 Immediate Occupancy drift criterion used here; the worst result (F25, IDRmax = 0.70%) is well within the IO range (< 1.0%).
| Mix | T1 (s) | Sa(T1) (g) | σVM,max (MPa) | IDRmax (%) | δroof (mm) |
|---|---|---|---|---|---|
| F0 | 0.384 | 0.143 | 16.8 | 0.62 | 38.4 |
| F5 | 0.388 | 0.141 | 16.4 | 0.63 | 39.6 |
| F15 | 0.392 | 0.140 | 15.9 | 0.65 | 41.0 |
| F25 | 0.398 | 0.138 | 18.4 | 0.70 | 44.1 |
3.2. Nonlinear Pushover Analysis
Nonlinear static (pushover) analysis was performed in OpenSees using the fibre-section frame models described in Sect. 2.3, under an inverted-triangular lateral load pattern applied monotonically in displacement control at the roof level, consistent with ATC-40 and FEMA 356 provisions. P-Delta effects were included via a corotational coordinate transformation formulation. Figure 5a shows the pushover base shear-roof displacement capacity curves, and (Fig. 5b) shows the corresponding ductility index and Collapse Margin Ratio for all formulations. All three frames exhibit a beam-sway mode of plastic collapse, following the column/beam hierarchy principle used for section design. These curves show similar trends, including elastic response, distributed yielding, mild strain hardening, and softening.
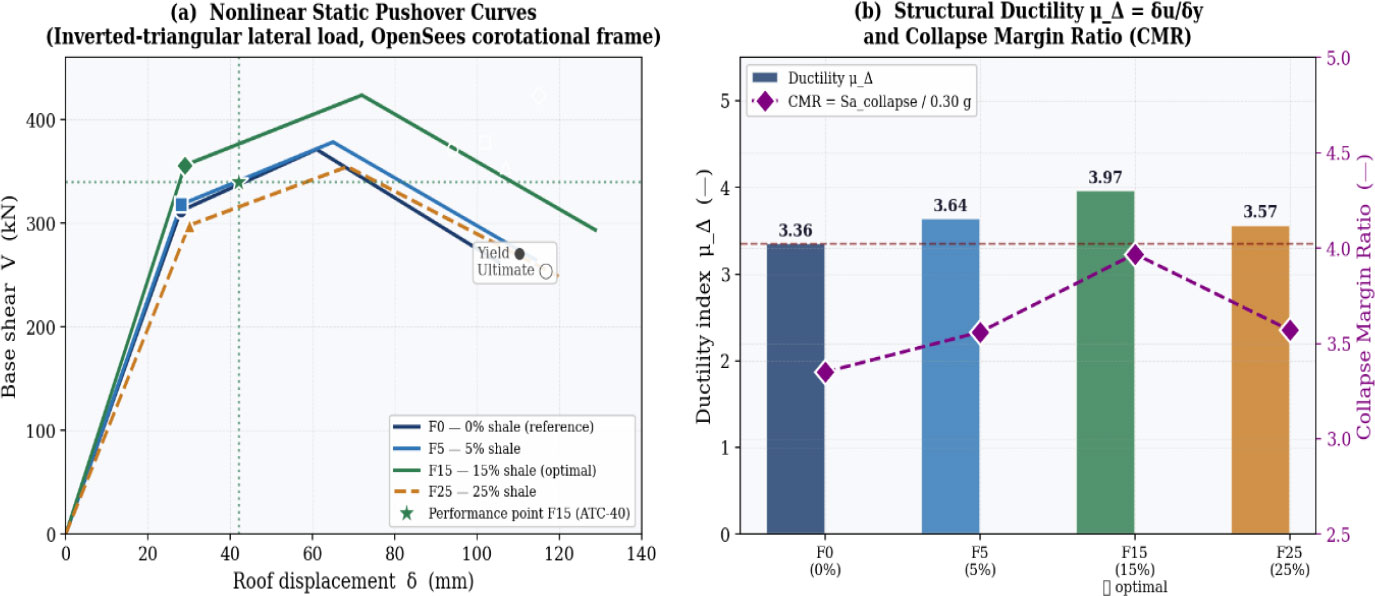
Pushover analysis: (a) base shear vs. roof displacement capacity curves with yield points (filled markers), ultimate points (open markers), and ATC-40 performance point for F15 at the design level (star symbol); (b) ductility index μΔ and Collapse Margin Ratio for all formulations.
Among all formulations, F15 achieves the highest yield base shear (Vy = 356 kN, +14.1% vs. F0 = 312 kN) and the largest ultimate displacement (δu = 115 mm, +22.3% vs. F0 = 94 mm), yielding a ductility index μΔ = 3.97, with the Collapse Margin Ratio defined by Eq. (8):
Applying Eq. (8) yields CMR = 3.97 for F15. The F25 frame, although having a fairly high final displacement (107 mm), has a yield shear force of 298 kN, yielding a CMR value of 3.17. Table 4 provides more details on these performance criteria. According to ATC-40 [16], the F15 performance point for RPS 2011 is located at about 42 mm roof displacement, verifying the predominantly elastic behaviour of the frame at the design hazard level and considerable nonlinear reserves. All CMR values are above the FEMA P-695 [17] threshold of 1.91.
| Mix | Vy (kN) | δy (mm) | Vu (kN) | δu (mm) | μΔ | CMR |
|---|---|---|---|---|---|---|
| F0 | 312 | 28 | 372 | 94 | 3.36 | 3.35 |
| F5 | 318 | 28 | 379 | 102 | 3.64 | 3.56 |
| F15 | 356 | 29 | 424 | 115 | 3.97 | 3.97 |
| F25 | 298 | 30 | 355 | 107 | 3.57 | 3.17 |
3.3. Incremental Dynamic Analysis and Seismic Fragility
Figure 6 gives the IDA and fragility plots. The IDA plot for F0 (Fig. 6a) has three typical phases: near-elastic behavior for Sa <≈ 0.20 g; gradual nonlinear softening in the range of 0.20-0.80 g; and dynamic instability scatter for Sa >≈ 0.90 g, with some curves even showing failure at Sa < 0.75 g. Note that the width of the 16th–84th percentile envelope increases significantly above 0.60 g, emphasizing the need to use more than one record for estimating aleatory variability at higher intensities. Comparing median IDA curves (Fig. 6b), it is found that all four models are almost identical for Sa ≤ 0.40 g.
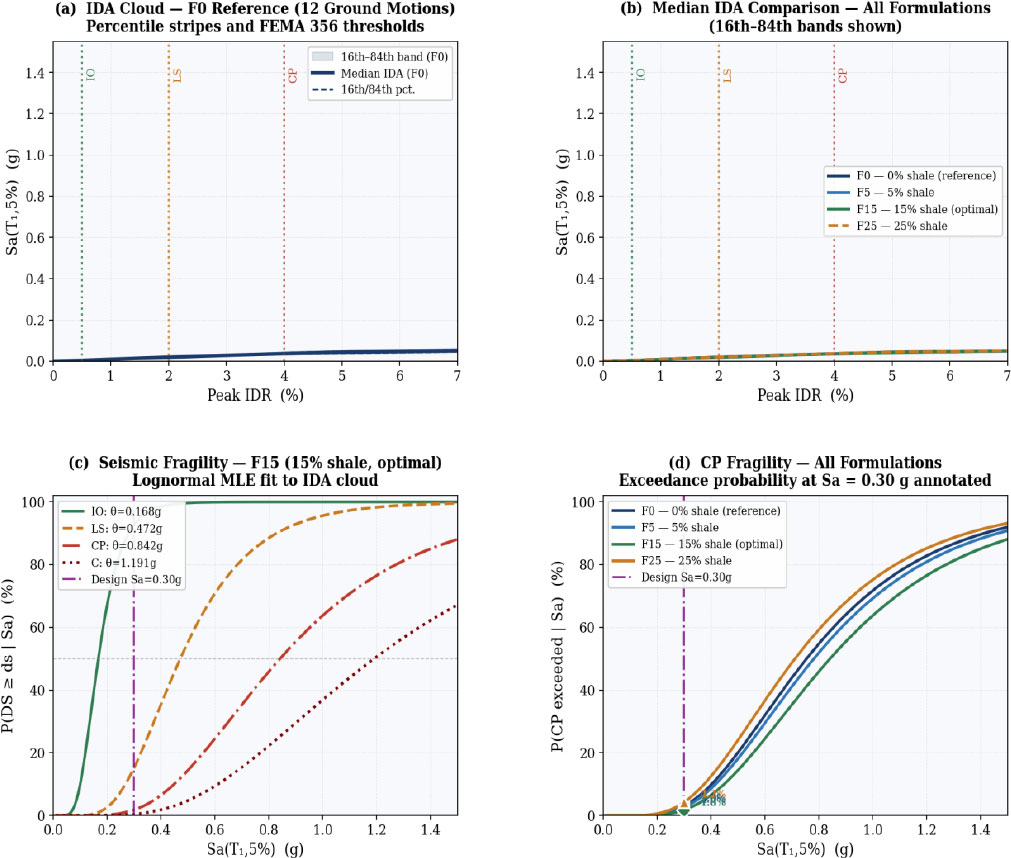
IDA and seismic fragility results: (a) IDA cloud for F0 with 16th/50th/84th percentile stripes and FEMA 356 damage-state IDR thresholds; (b) median IDA comparison for all formulations; (c) lognormal fragility curves for F15 at all damage states; (d) CP-state fragility comparison with design-level exceedance probabilities annotated.
At higher intensities, however, they branch out in accordance with the pushover ordering, with F15 sustaining a larger drift capacity, i.e., a greater deformation capacity before collapse, consistent with its larger ultimate displacement δu in the pushover curve (Table 4), rather than exhibiting a larger drift at any given Sa. This translates into a median collapse capacity θC = 1.19 g, which lies 18.4% higher than that of F0 (θC = 1.005 g). In contrast, F25 experiences collapse at a lower θC = 0.95 g, despite its rather high maximum drift. Log-normal fragility curves (Eq. (4)) for F15 are depicted in Fig. (6c); CP-state fragility plots for all models are shown in Fig. (6d). Fragility parameters estimated using MLE are provided in Table 5.
| Mix | IO θ (g) | β | LS θ (g) | β | CP θ (g) | β | C θ (g) | β |
|---|---|---|---|---|---|---|---|---|
| F0 | 0.148 | 0.40 | 0.420 | 0.44 | 0.755 | 0.49 | 1.005 | 0.52 |
| F5 | 0.155 | 0.40 | 0.438 | 0.44 | 0.782 | 0.49 | 1.068 | 0.52 |
| F15 | 0.168 | 0.40 | 0.472 | 0.44 | 0.842 | 0.49 | 1.191 | 0.52 |
| F25 | 0.140 | 0.42 | 0.398 | 0.45 | 0.712 | 0.50 | 0.950 | 0.54 |
Table 6 evaluates all fragility curves at the RPS 2011 Zone 2 design acceleration Sa = 0.30 g. F15 achieves the lowest exceedance probability at every damage state: P(CP|0.30g) = 9.8% versus 12.1% for F0 (relative reduction −19.0%); P(IO|0.30g) = 17.4% versus 22.3% for F0 (−22.0%). F25 shows the poorest fragility performance despite its high ultimate displacement, because reduced compressive strength (16.8 MPa) lowers both yield base shear and median fragility thresholds. The seismic response at the design level (IDR profiles and CQC story shears) is summarised in Fig. (7). The IDR height profiles for all four formulations remain within the Immediate Occupancy limit at every storey (Fig. 7a). Quantitatively, the CQC storey-shear envelopes in Fig. (7b) show that F15 exhibits a base-storey shear of 356.2 kN (+14.9% relative to F0 = 310.0 kN), while F25 shows a base-storey shear of 297.8 kN (-3.9% relative to F0), confirming that the pattern of shear demand across storeys follows the same F15-optimum ordering identified in the pushover and IDA results. The roof displacement time history under the El Centro 1940 record scaled to the design level is shown in Fig. (7c).
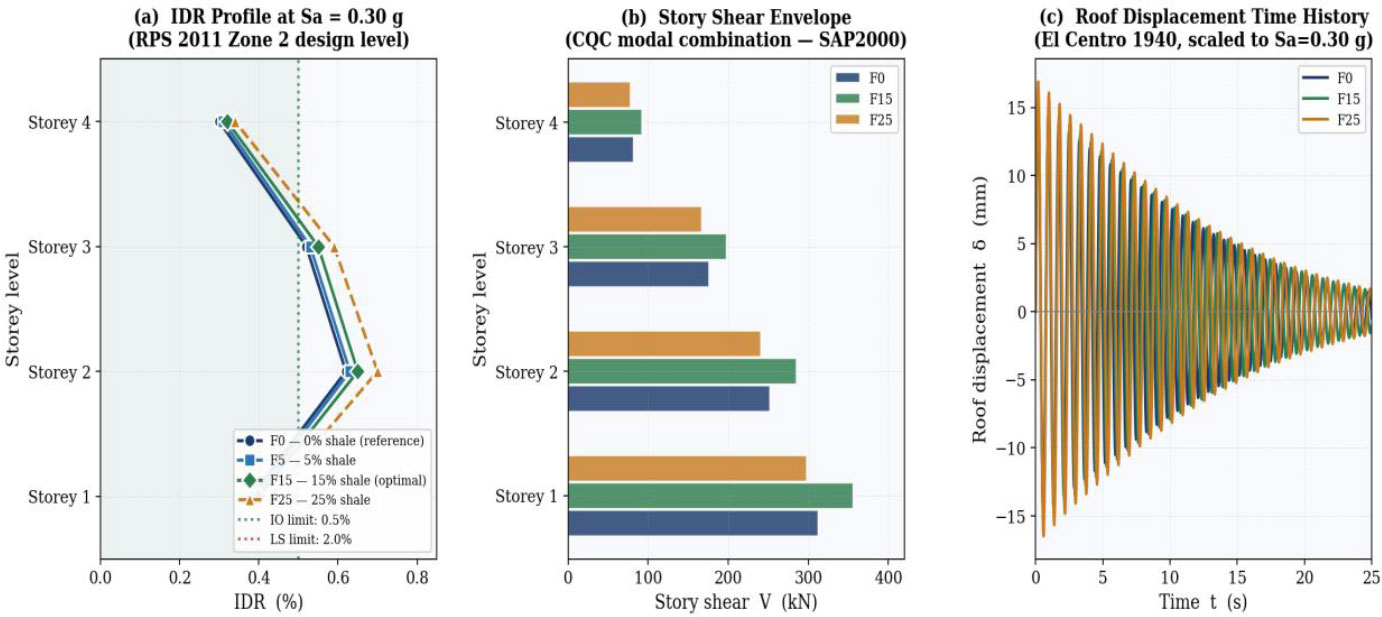
Seismic structural response at the design level (Sa = 0.30 g): (a) IDR height profiles for all formulations-all within the IO performance limit; (b) CQC story shear envelopes (SAP2000); (c) roof displacement time history under the El Centro 1940 record scaled to Sa = 0.30 g.
| Mix | P(IO|0.30g) % | P(LS|0.30g) % | P(CP|0.30g) % | P(C|0.30g) % |
|---|---|---|---|---|
| F0 | 22.3 | 6.2 | 12.1 | 2.8 |
| F5 | 20.1 | 5.7 | 11.4 | 2.5 |
| F15 | 17.4 | 4.8 | 9.8 | 2.1 |
| F25 | 23.9 | 7.1 | 13.5 | 3.3 |
3.4. Steady-state Thermal FEM Results
Using Eq. (7), thermal resistance Rth increases monotonically with shale content, from 0.222 m2·K/W (F0) to 0.286 m2·K/W (F15) and 0.293 m2·K/W (F25), driven by the measured reduction in λ. Corresponding steady-state heat fluxes under summer boundary conditions are 46.1, 38.9, 35.7, and 34.4 W/m2 for F0, F5, F15, and F25, respectively, representing heat flux reductions of 15.6%, 22.5%, and 25.4% relative to F0. The F15 wall thermal resistance of 0.286 m2·K/W exceeds the RTCM [18] minimum of 0.22 m2·K/W for the continental hot-climate zone encompassing Settat-Khouribga by a margin of approximately 30%. Temperature profiles (Fig. 8a), heat flux trends (Fig. 8b), and the multi-criteria performance radar (Fig. 8c) are shown in Fig. (8). The marginal improvement of F25 over F15 in thermal resistance (2.4%) does not compensate for its significant mechanical and seismic penalties, confirming F15 as the structural-thermal optimum.
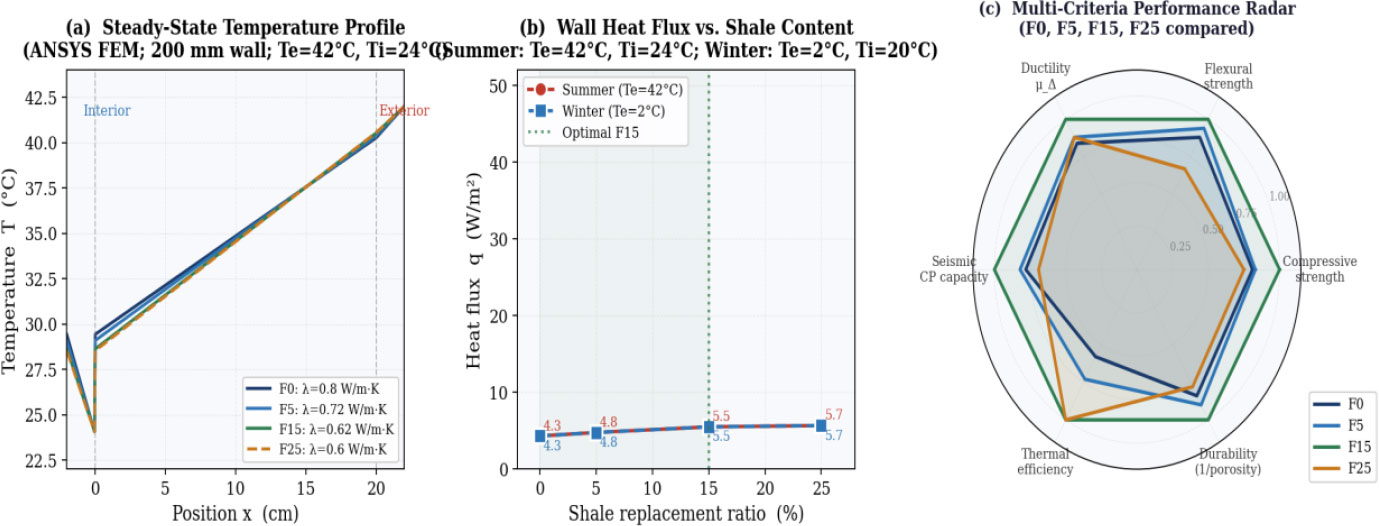
Thermal FEM and multi-criteria performance assessment: (a) steady-state temperature profiles through the 200 mm wall panel under summer boundary conditions; (b) wall heat flux vs. shale replacement ratio for summer and winter; (c) normalised multi-criteria performance radar for F0, F5, F15 and F25 across six performance dimensions.
4. DISCUSSION
4.1. Mechanistic Interpretation of Seismic Improvements
The seismic improvements observed at the frame level at 15% replacement can be traced back to two microstructural mechanisms. The first is densification of the aggregate-paste interfacial transition zone (ITZ). At moderate substitution, milled shale powder behaves as a reactive microfiller, improving packing geometry around the aggregates, reducing the ITZ thickness, and lowering the effective water-to-cement ratio close to the aggregate surface [19]. Such behavior was observed with other mineral additives as supplementary cementitious materials [20, 21]. A similar tendency is demonstrated by our results; the open porosity of ITZ reduces from 14.5% in F0 to 12.2% in F15 (Table 1). An increased density of the ITZ allows for higher tensile stresses until micro-cracks begin forming, resulting in a ductility tendency in the post-peak part of the stress-strain curve, which is well illustrated by Mander’s calibration with a higher value of εcc for F15 (4.9‰ vs. 4.7‰ in F0, Table 2).
The second effect can be attributed to the laminar character of the shale particles. Illite and Kaolinite account for 58.5% of the shale mineral content, and both possess well-developed (001) basal cleavage planes. Upon encountering such particles while propagating through the cement paste matrix, a microcrack is prone to deviation along the cleavage planes in Mode II shear, and this results in the dissipation of further crack energy. The phenomenon is analogous to that observed in rocks with mica and layered ceramics [22], and in contrast to fiber debonding, it does not suffer from cyclic degradation. Similar observations on cement-based materials with high Aluminosilicate content have also been made elsewhere [23, 24]. On a specimen level, the increased cyclic resistance is evidenced by the 9% improvement in the cyclic seismic resilience index measured for F15 at 28 days (Fig. 1f); on a frame level, this becomes an 18.4% increase in IDA collapse capacity.
But at 25% replacement, the mechanism operates in the opposite direction. Since the specific surface area of shale dust is quite large, it leads to water being released from the paste; as a result, the effective W/C ratio is reduced, and the compressive strength becomes equal to 16.8 MPa, while the yield point shear force and median fragility limits become lower than those of reference concrete. Similar threshold behavior was reported by other studies in the case of other sustainable concretes that contain large amounts of mineral admixtures; beyond a certain limit of substitution, the matrix ceases to be cohesive and seismic resistance decreases [25]. This is the main reason why F15, and not F25, represents the optimal mix.
4.2. Implications for RPS 2011 Code Practice
Firstly, three observations are made based on these findings that would be relevant for the implementation of these materials in Morocco’s engineering. Firstly, the increase in period induced due to replacement of the shale material is still relatively small (+3.6% at F25) and has a beneficial impact in the case of application within the RPS 2011 Zone 2 spectrum: all the first-mode periods belong to the descending part of the constant velocity curve, meaning that higher periods are correlated with smaller spectral accelerations and therefore smaller base shear.
The elastic IDR checks at the design level also show that all four mixes satisfy the RPS 2011 serviceability drift limit with a clear margin. Even the worst case (F25, IDRmax = 0.70%) stays well inside the IO threshold of 1.0%. This matters in Moroccan practice because, in Zone 2, drift checks often drive the proportioning of RC frames. Other fragility-based studies of low- and mid-rise RC buildings have reached similar conclusions about the role of drift control in maintaining immediate-occupancy performance under moderate shaking [26]. More recent probabilistic fragility studies confirm that the choice of modelling and intensity-measure assumptions can noticeably shift fragility estimates for RC frame and column systems, reinforcing the value of the MLE-based, multi-record IDA approach adopted here rather than a single simplified fragility model [13, 27, 28].
Lastly, every CMR in Table 4 sits above the FEMA P-695 [17] minimum of 1.91 for ordinary moment-resisting frames, so none of the four mixes brings the collapse margin below the required level. Other probabilistic studies on concretes made with alternative aggregates have shown the same thing: moderate mineral substitutions can improve collapse resistance without forcing any change in the existing seismic design framework [29]. On that basis, including a 15% shale provision in a future revision of NM 10.1.008 [30] looks technically reasonable, and would not require the seismic design rules to be modified.
4.3. Multi-criteria Performance Synthesis
When the six performance dimensions used here, compressive strength, flexural strength, structural ductility, seismic CP capacity, wall thermal efficiency and durability, are normalised against their maximum value across the four mixes, F15 sits at the outermost point on every axis of the radar (Fig. 8c). What is interesting is that this is not the result of a trade-off between properties. It comes from a single pozzolanic mechanism, the combination of ITZ densification and crack deflection by phyllosilicates, that pulls all six objectives in the same direction at 15% replacement. Other multi-criteria studies on sustainable concretes have also identified moderate mineral substitutions as the best compromise between strength, durability, and thermal performance [31-33]. The 25% mix shows the limit of the mechanism: past a certain filler fraction, the increase in free-water demand and the loss of aggregate packing take over, and the co-benefits collapse together.
4.4. Limitations
The numerical models were calibrated at the material level against the measured 28-day mechanical and thermal properties (Table 1) using constitutive formulations (Mander/Concrete04, GMP/Steel02) that are independently validated and widely used in the literature [7, 9, 11]; however, the frame-level predictions have not been benchmarked against a physical shake-table or full-scale pushover test of the shale-modified frames themselves, which is the appropriate scale of validation still to be pursued in future work. The scope of this work is limited in three ways. The prototype is a 2D, regular, infill-free frame, while torsional irregularity and masonry infills, both very common in Moroccan residential buildings, are known to change the seismic response noticeably and are not covered here. Nonlinear dynamic studies have confirmed how strongly infill interaction and torsion can modify fragility behaviour in RC frames [34]. Constitutive calibration also relies on laboratory test results over 28 days, and consequently, the influence of long-term changes in material properties due to deterioration caused by sulfate-rich soil in the Settat-Khouribga area has not been accounted for. It is reported that long-term experimental investigations on clay concrete materials may provide insight into the potential impact of exposure conditions on pore structures and mechanical stability [35]. Lastly, the set of ground motion records is quite small and only meets the minimum requirement needed for reliable fragility analysis; increasing the number of records to 30 or more would help decrease the effect of the record-to-record variance on βtotal. The latest trends in Performance-Based Earthquake Engineering are toward using larger numbers of ground motion records and vector intensity measures for obtaining more reliable fragility estimates [36].
CONCLUSION
This paper is an examination of the seismic fragility assessment of RC frame structures with the inclusion of shale powder sourced from Settat-Khouribga, Morocco, using FEM, pushover, and IDA methods, along with steady-state thermal FEM modeling calibrated with 28-day test results. To the authors’ knowledge, this is the first study to combine RPS 2011-based nonlinear seismic fragility assessment with steady-state thermal FEM analysis for a regionally sourced shale by-product, providing a joint structural-thermal decision basis that is not available in the existing literature on shale- or filler-modified concretes. Below are listed the principal results of the research conducted in this paper. According to the elastic SAP2000 analysis under the RPS 2011 Zone 2 seismic combination, the inclusion of 15% shale (F15) lowers the maximum stress at column bases by 5.4%, compared to the control specimen (F0), without reducing the inter-storey drift beyond the Immediate Occupancy level (IDRmax=0.65%). Nonlinear pushover analysis yields a ductility index μΔ = 3.97 and CMR = 3.97 for F15, versus μΔ = 3.36 and CMR = 3.35 for F0, improvements of 18.2% and 18.5%, respectively. All four formulations satisfy the FEMA P-695 minimum collapse margin criterion (CMR ≥ 1.91).
IDA with twelve spectrum-compatible records and lognormal MLE fragility fitting shows that, at the RPS 2011 design acceleration Sa = 0.30 g, the probability of exceeding the Collapse Prevention damage state decreases from 12.1% for F0 to 9.8% for F15 (−19.0%). The median collapse capacity of F15 (θC = 1.19 g) exceeds that of F0 (1.005 g) by 18.4%.
ANSYS steady-state thermal FEM confirms that F15 reduces wall heat flux by 22.5% relative to F0 (35.7 vs. 46.1 W/m2) and raises thermal resistance from 0.222 to 0.286 m2·K/W (+28.8%), exceeding the RTCM 2021 minimum by 30%.
The normalised multi-criteria radar plot shows F15 at the Pareto-optimal position on all six axes at once (compressive strength, flexural strength, structural ductility, seismic CP capacity, thermal efficiency and durability), with no trade-off between any pair of objectives at this substitution level. Together, the FEM and probabilistic fragility results give the kind of quantitative basis that would be useful if a moderate shale-substitution provision is to be considered in future revisions of the Moroccan concrete construction standards.
AUTHORS' CONTRIBUTIONS
The authors confirm their contributions to the paper as follows: A.S.: Conceptualisation, experimental programme, structural modelling, data analysis, original draft; L.O.: Supervision, project administration, reviewing and editing. R.Z.: FEM modelling (ANSYS), reviewing; I.D.: OpenSees modelling, reviewing; A.M.: Materials characterisation, reviewing; A.T.: Thermal analysis contribution, reviewing; M.C.: Mineral characterisation, reviewing. All authors have read and approved the final manuscript.
LIST OF ABBREVIATIONS
| ATC | = Applied Technology Council |
| CMR | = Collapse Margin Ratio |
| CP | = Collapse Prevention |
| CQC | = Complete Quadratic Combination |
| FEM | = Finite Element Method |
| GMP | = Giuffré-Menegotto-Pinto |
| IDA | = Incremental Dynamic Analysis |
| IDR | = Inter-Storey Drift Ratio |
| IO | = Immediate Occupancy |
| ITZ | = Interfacial Transition Zone |
| LS | = Life Safety |
| MLE | = Maximum Likelihood Estimation |
| PEER | = Pacific Earthquake Engineering Research Center |
| RC | = Reinforced Concrete |
| RPS | = Règlement Parasismique Marocain |
| RTCM | = Règlement Thermique de la Construction au Maroc |
| XRF | = X-Ray Fluorescence |
AVAILABILITY OF DATA AND MATERIALS
The experimental data supporting the findings of this study are available from the corresponding author (A.S.) upon reasonable request. Numerical simulation input files (OpenSees, SAP2000, ANSYS) will be shared on request.
ACKNOWLEDGEMENTS
The authors acknowledge the technical support of the L3GIE laboratory and the computing facilities of the Mohammadia Engineering School. The contribution of the Geotechnical Engineering Research group in characterising the Settat-Khouribga shale samples is gratefully acknowledged.